Description
When I tell traders I’m looking at patterns that span five decades, I usually get two reactions: either they think I’m mining useless noise, or they immediately want to know what the data shows. If you’re in the second camp, you’re in the right place.
Today, I’m walking through a complete seasonal pattern analysis for McDonald’s Corporation (MCD) — not as theory, but as a real trading blueprint. This is the kind of edge that I have designed to find: statistically robust, consistently profitable, and based on actual market behavior stretching back to 1970.
The Pattern: A 56-Year Edge
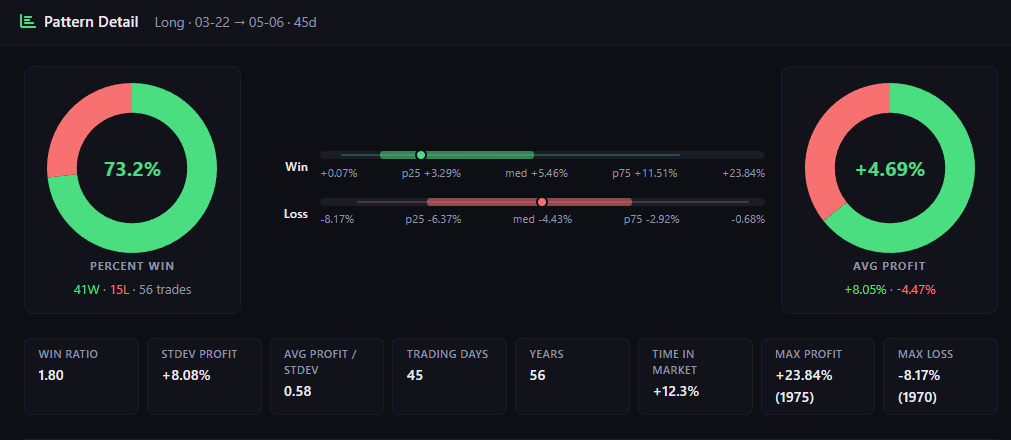
Let’s start with what the data tells us. The pattern we’re analyzing runs from March 22 to May 6 — a precise 45-day trading window. Over 56 years of historical data, this specific period has delivered exceptional results:
- Win Rate: 73.2% (41 winning years out of 56)
- Average Profit: +4.69%
- Win Ratio: 1.80 (wins are 1.8x larger than losses on average)
- Standard Deviation of Profit: 8.08%
- Sharpe-like Metric (Avg/StDev): 0.58
These aren’t cherry-picked numbers from a handful of good years. This is what happens when you systematically enter the same trade at the same time, year after year, for more than half a century.
The performance distribution tells the story clearly: the median win sits at +5.46%, while the median loss is only -4.43%. The p75 win reaches +11.51%, and even the p25 win delivers +3.29%. Meanwhile, the worst percentile losses (p25 at -6.37%) are smaller in magnitude than the median gains. This is the kind of asymmetry that systematic traders dream about.
Consistency Across Decades
One pattern can be lucky. A pattern that persists across 56 years is something else entirely.
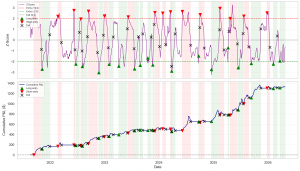
Looking at the yearly profit breakdown, you see green bars dominating the chart. The wins aren’t just frequent, they’re substantial. Some years delivered returns exceeding 20%, like the standout performances in 1973, 1980, 2002, and 2020. Even in losing years, the drawdowns are typically contained in the -5% to -7% range, with only occasional deeper dips.
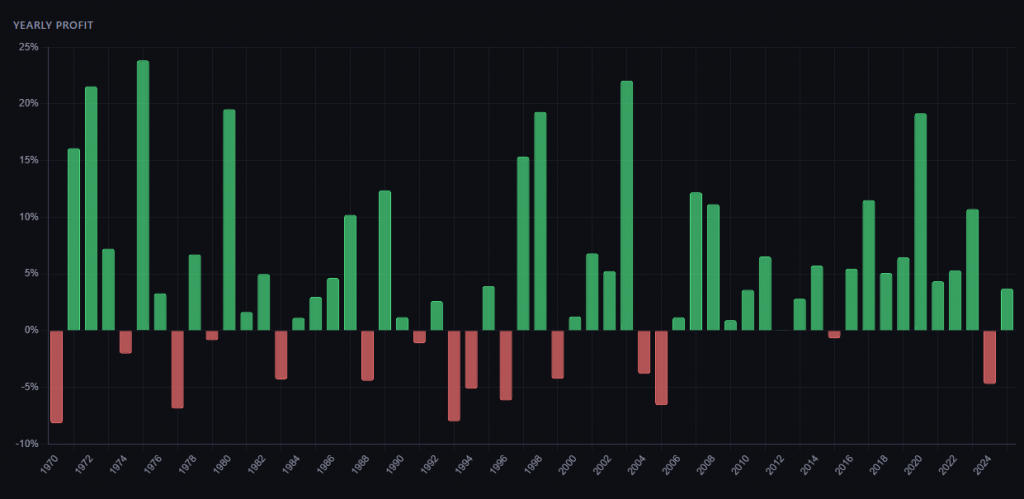
What’s particularly compelling is the pattern’s resilience through radically different market regimes: stagflation in the ’70s, the tech boom and bust, the 2008 financial crisis, COVID-19, and the 2022 bear market. The pattern keeps working because it’s tied to something fundamental about McDonald’s business cycle, not to a specific macroeconomic regime.
The Seasonal Tendency
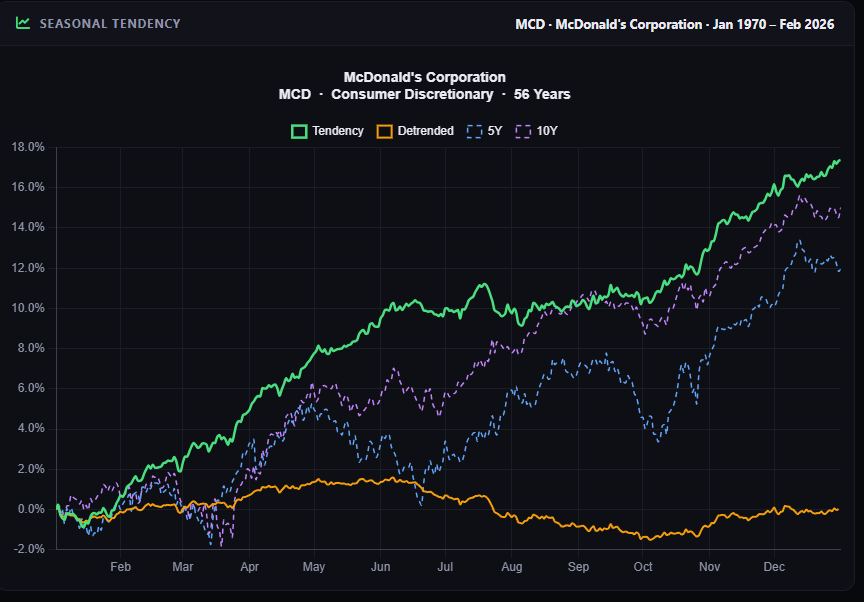
Here’s where it gets interesting. The seasonal tendency chart shows three overlays:
- The green line represents the core pattern over the entire period
- The orange line shows a detrended view
- The purple lines (5-year and 10-year lookbacks) show recent behavior
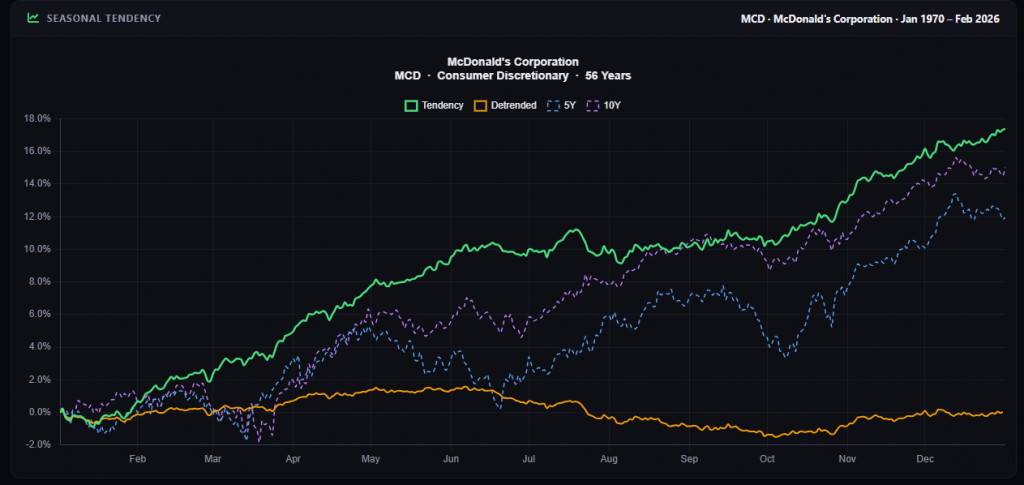
From late March through early May, McDonald’s exhibits a clear, persistent upward drift. This isn’t just a statistical artifact — it’s likely tied to the company’s Q1 earnings reporting cycle and the transition from winter promotional periods into spring consumer behavior patterns.
The detrended view (orange) confirms this isn’t just riding the overall market trend. Even after removing the secular bull market drift, the March-May window shows outperformance. And critically, the 5-year and 10-year views track closely with the long-term pattern, indicating the edge hasn’t degraded over time. If anything, recent years show the pattern strengthening.
The Cumulative Edge
The cumulative equity curve is where long-term systematic trading becomes undeniable. If you had entered this exact pattern — and only this pattern — every single year from 1970 onward, your cumulative return would exceed 250%. Buy-and-hold, meanwhile, would have delivered roughly 100% over the same period when measured purely through this seasonal window.
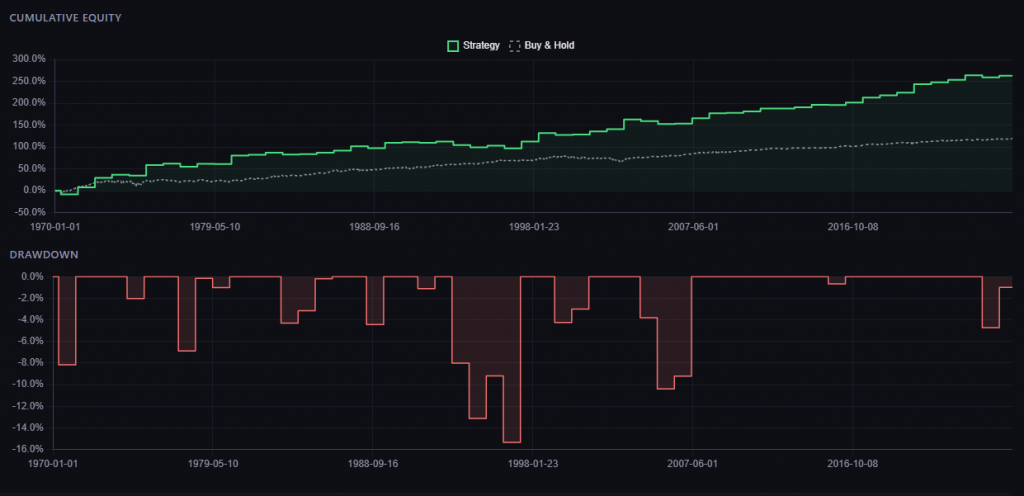
The drawdown chart below the equity curve shows something equally important: the maximum historical drawdown was contained to around -16%, occurring during the 1998 period. Most drawdown periods are shallow and brief, typically recovering within one to two years. The strategy shows impressive resilience, with long stretches of steady upward progress punctuated by only minor setbacks.
This is what consistency looks like when compounded over time.
Why This Pattern Exists
As a physicist-turned-trader, I’m wired to ask why before I ask how much. Seasonal patterns aren’t random; they exist because of recurring business fundamentals.
For McDonald’s, the late March to early May window likely captures several factors:
- Q1 Earnings Momentum: McDonald’s typically reports Q1 earnings in late April, and the market often anticipates positive results during the lead-up period.
- Spring Menu Transitions: The company shifts promotional focus from winter comfort foods to spring/summer offerings, often introducing new menu items that drive traffic.
- Consumer Behavior Cycles: Tax refunds hit accounts in March and April, boosting discretionary spending at quick-service restaurants.
- Institutional Positioning: Fund managers rebalance portfolios post-Q1, and consumer discretionary stocks like MCD often benefit from renewed interest heading into the summer earnings season.
These aren’t speculative narratives; they’re business cycle realities that have repeated for decades. The pattern works because the underlying drivers persist.
Risk and Reality
Let’s be brutally honest: 73.2% win rate doesn’t mean 100%. You will have losing years. In fact, you should expect roughly 1 loss for every 3 wins based on historical frequency.
The maximum historical loss was -8.17% (in 1970), and the data shows you’ll occasionally face years with -5% to -7% losses. But compare that to the maximum historical gain of +23.84% (in 1975) and the average win of +8.05%. The risk-reward profile is heavily skewed in your favor.
The key discipline is position sizing. Even with a strong edge, you never bet the farm on a single pattern. Systematic traders allocate defined risk to each opportunity, ensuring that a single loss — or even a string of losses — doesn’t derail the overall portfolio.
This pattern runs for 45 trading days and has proven effective over 56 years. The holding period is long enough to avoid noise but short enough to avoid exposing capital to unrelated market events. You’re in the trade for a specific, predictable business cycle, not grinding through an entire year.
The time in market for this specific pattern is roughly +12.3%, meaning that if you simply entered on March 22 and exited on May 6 every year, you would have been exposed to market risk only about 12% of the calendar year, yet captured a disproportionate share of returns.
Putting It Into Practice
When you find a pattern like McDonald’s March 22 – May 6 window, you don’t need to overcomplicate the execution. You could trade it with:
- Directional equity (simply buy shares on March 22, sell on May 6)
- Long call options (out-of-the-money calls expiring in mid-May)
- Bull call spreads (defined risk, capped upside, capital-efficient)
The choice depends on your risk tolerance, capital efficiency goals, and whether you want leverage or simplicity. The edge is in the timing, not the instrument.
Final Thoughts
Systematic trading isn’t about predicting the future; it’s about recognizing patterns in the past that have structural, repeatable drivers. McDonald’s March 22 – May 6 window isn’t magic. It’s 56 years of compounded evidence that during this specific 45-day period, the stock has a measurable tendency to rise.
Will it work every year? No.
Will it work most years? History says yes.
Is that enough to build a strategy? Absolutely.
This is how you construct high-probability trades: you start with decades of data, you identify robust patterns, and you execute with discipline. One pattern isn’t a portfolio, but 10, 20, or 50 uncorrelated patterns across different tickers and timeframes? Now you’re building something real.
This is the mindset behind The Quantitative Edge — simple ideas, implemented cleanly, that scale into powerful tools for data-driven trading.
Statemi bene!