Description
I often find that a simple physics analogy makes trading concepts easier to grasp, particularly when explaining the difference between what’s moving and what’s already there, the flux and the state. The flux measures flow through a surface, like current through a wire. The state describes what exists at a point in time, like charge accumulated in a capacitor. Options markets have a similar duality: volume measures the flow of contracts trading today, while open interest describes the total number of contracts that are still open and exist in the market.
These two metrics are fundamental for the options traders, yet they’re often confused because they sound similar. Understanding the distinction — and more importantly, how they interact — is critical for assessing liquidity, interpreting market sentiment, and ensuring your trades execute at fair prices.
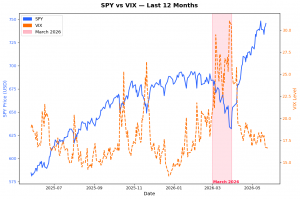
In this post, we’ll build up both concepts rigorously and show you how to analyze them using Python with real market data. We’ll use SPY options as our example and demonstrate why high volume with low open interest tells a completely different story than low volume with high open interest.
This is essential knowledge for any systematic trader — because trading illiquid options is like measuring voltage with a broken voltmeter. The numbers might look right, but they’re meaningless.
Volume: What Traded Today
Volume is the number of contracts that changed hands during a given period — typically today’s trading session. Options volume starts fresh every trading day, which means the counter is reset at the start of a new session. This simply tells us how many contracts were traded during that session, measuring the transactions rather than the positions, meaning every trade contributes to volume regardless of whether it opens or closes a position.
Volume is also tracked separately for each strike price and expiration date, giving a very granular view of activity across the options chain. And because it includes both opening and closing trades, it’s best thought of as a snapshot of where the action is happening, not how many contracts are still being held.
For example, if the SPY 450 Call shows volume of 3,200, this means 3,200 contracts traded at that strike today. It does not mean 3,200 contracts currently exist — it means that many changed hands.
Volume answers a single question: “Is this option being actively traded right now?”
When the option has high volume, trading tends to feel much easier. Bid-ask spreads are usually tight, which keeps transaction costs low and makes getting in or out of a position smoother. Prices tend to react quickly to new information, reflecting what the market is thinking right now, and the heavy activity signals strong interest from other market participants.
On the other hand, low volume often comes with a few headaches. Bid-ask spreads widen, which can quickly eat into returns through higher trading costs. Entering or exiting a position may cause slippage, especially if you’re trading more contracts, and prices can lag behind reality or jump unexpectedly. In short, low volume usually means limited liquidity and a market that’s harder to trade efficiently.
For a physicist, think of volume as the rate of flow — it tells you how much trading activity is happening, not how many positions exist.
Open Interest: What Exists
Open interest (OI) is the total number of outstanding option contracts that have been opened but not yet closed or exercised. Open interest accumulates over time rather than resetting at the end of each trading session. It only changes when new option positions are opened or when existing ones are closed, which makes it a good snapshot of the actual exposure in the market. Like volume, it is tracked separately for each strike and expiration, but instead of showing activity, it represents the net positions currently held by all market participants.
For example, if the SPY 450 Call shows open interest of 15,000, this means 15,000 contracts currently exist at that strike. These contracts were opened at various times and remain unclosed.
This is where the distinction becomes critical. Not every trade changes open interest.
| Trade Action | Volume Change | Open Interest Change | What It Means |
|---|---|---|---|
| Buyer opens a new long, Seller opens a new short | +1 | +1 | A brand-new contract is created; total market exposure increases |
| Buyer closes an existing long, Seller closes an existing short | +1 | −1 | An existing contract is removed; market exposure decreases |
| Buyer opens a new long, Seller closes an existing short | +1 | 0 | The contract changes hands; open interest stays the same |
| Buyer closes an existing long, Seller opens a new short | +1 | 0 | The contract changes hands; open interest stays the same |
Every trade increases volume by 1, but open interest can increase, decrease, or stay unchanged depending on whether the parties are opening or closing positions. Open interest counts contracts, not traders. One contract = one increase in open interest, regardless of the long/short sides.
For a physicist, think of open interest as the state variable — it tells you how many contracts currently exist in the system.
Why Volume and OI Matter for Options Traders
For options traders, understanding volume and open interest (OI) is absolutely critical — they’re the twin indicators that tell you whether a market is liquid, fair, and reliable.
High volume shows active trading today, while high OI signals that substantial positions already exist. Together, they ensure tight bid-ask spreads, efficient price discovery, and reliable execution. Trading an option with tiny volume and low OI is like trying to sell a rare collectible — you might get stuck with a terrible price simply because there’s no active market.
Volume and OI validate implied volatility and expected moves (for more on this, read my previous blog Expected Move). Thinly traded options often produce distorted prices, making IV calculations meaningless. When only a handful of contracts trade, the bid-ask spread can be very wide, and a single trade can dramatically move the recorded market price. That means derived metrics like implied volatility or expected moves may be misleading, because they rely on prices that don’t reflect the consensus of buyers and sellers. In contrast, ATM options with high volume and OI tend to produce more reliable IV readings, giving traders a trustworthy view of market expectations.
Liquidity is another reason these metrics matter. When you enter a spread where one leg has low volume, it may be difficult to close that leg later — especially in volatile markets. Professionals often use simple thresholds to avoid these problems: volume above 100–200 contracts, OI above 500–1,000 contracts, and bid-ask spreads under 5–10% of the option price. These aren’t arbitrary numbers — they help reduce trading costs and execution risk. When entering spreads, you need both legs to be liquid.
The real insight emerges when you interpret volume and OI together. Rising volume alongside rising OI usually signals new money entering the market, increasing conviction, and positions being established — often the start of a trend. For example, if SPY 460 calls trade 8,000 contracts while OI rises from 12,000 to 18,000, it’s a clear sign of bullish positioning. Conversely, rising volume with falling OI indicates existing positions are being closed, whether for profit-taking or loss-cutting, potentially signaling trend exhaustion. High OI at a specific strike can also act as a “magnet,” influencing market maker hedging and sometimes even guiding the stock toward that strike as expiration approaches — a phenomenon traders call pinning.
In short, volume and OI aren’t just numbers; they’re a window into market behavior, positioning, and sentiment, helping traders separate meaningful signals from noise.
Python Code
Let’s analyze real SPY options data to see volume and open interest patterns.
import yfinance as yf
import pandas as pd
import numpy as np
import matplotlib.pyplot as plt

# Download SPY data
spy = yf.Ticker("SPY")
spy_price = spy.history(period='1d')['Close'].iloc[-1]

print(f"SPY Current Price: ${spy_price:.2f}")

# Get available expirations
expirations = spy.options

# Select nearest expiration
expiration = expirations[0]
print(f"\nAnalyzing Expiration: {expiration}")

# Download option chain
chain = spy.option_chain(expiration)
calls = chain.calls
puts = chain.puts

print(f"\nCalls: {len(calls)} strikes")
print(f"Puts: {len(puts)} strikes")
From the option chain data, we can compute some statistical metrics, filtering the strikes within a certain percentage band from the current price
# Filter for reasonable strikes (within ±10% of current price)
strike_range = 0.10
lower_bound = spy_price * (1 - strike_range)
upper_bound = spy_price * (1 + strike_range)

calls_filtered = calls[(calls['strike'] >= lower_bound) & (calls['strike'] <= upper_bound)]
puts_filtered = puts[(puts['strike'] >= lower_bound) & (puts['strike'] <= upper_bound)]

# Summary statistics
print(f"VOLUME AND OPEN INTEREST ANALYSIS")

print(f"\nCALLS Summary:")
print(f"  Total Volume: {calls_filtered['volume'].sum():,.0f}")
print(f"  Total Open Interest: {calls_filtered['openInterest'].sum():,.0f}")
print(f"  Avg Volume per Strike: {calls_filtered['volume'].mean():,.0f}")
print(f"  Avg OI per Strike: {calls_filtered['openInterest'].mean():,.0f}")

print(f"\nPUTS Summary:")
print(f"  Total Volume: {puts_filtered['volume'].sum():,.0f}")
print(f"  Total Open Interest: {puts_filtered['openInterest'].sum():,.0f}")
print(f"  Avg Volume per Strike: {puts_filtered['volume'].mean():,.0f}")
print(f"  Avg OI per Strike: {puts_filtered['openInterest'].mean():,.0f}")

# Volume to OI ratio
calls_filtered['vol_oi_ratio'] = calls_filtered['volume'] / calls_filtered['openInterest'].replace(0, np.nan)
puts_filtered['vol_oi_ratio'] = puts_filtered['volume'] / puts_filtered['openInterest'].replace(0, np.nan)

avg_call_ratio = calls_filtered['vol_oi_ratio'].mean()
avg_put_ratio = puts_filtered['vol_oi_ratio'].mean()

print(f"\nVolume/OI Ratios:")
print(f"  Calls: {avg_call_ratio:.3f}")
print(f"  Puts: {avg_put_ratio:.3f}")

if avg_call_ratio > 0.5:
    print("  → High turnover in calls (active trading)")
else:
    print("  → Low turnover in calls (positions being held)")

if avg_put_ratio > 0.5:
    print("  → High turnover in puts (active trading)")
else:
    print("  → Low turnover in puts (positions being held)")
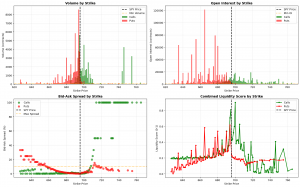
With this code, you can select the nearest expiration and fetch the corresponding option chain, separating calls and puts, and then filter options within ±10% of the current SPY price. The script then calculates basic summary statistics for both calls and puts, including total volume, total open interest, and average volume and open interest per strike, giving a snapshot of where market activity is concentrated.
Next, we compute the volume-to-open-interest ratio for each strike, which measures the relative turnover of positions. A higher ratio indicates active trading, while a lower ratio suggests positions are being held. It then averages these ratios across all filtered calls and puts, providing a quick gauge of market activity and sentiment.
How Is It Used in Reality?
Suppose SPY is trading at $500. You look at the 505 call and see:
- Open interest = 10,000 contracts
- Today’s volume = 6,000 contracts
The volume/OI ratio = 0.6, which is high. This indicates a lot of trading activity relative to the number of contracts open, meaning traders are either adding to or adjusting positions. A trader could interpret this as a potential bullish signal: market participants are actively buying the 505 calls, betting on SPY moving higher before expiration. Conversely, if the 495 put had high volume but falling OI, it could indicate bearish positions are being closed, suggesting that downward pressure may be easing.
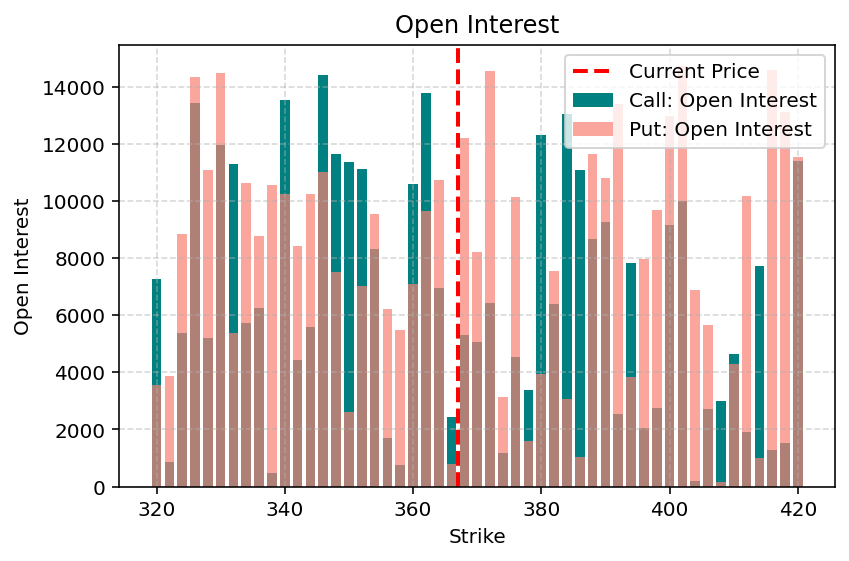
By combining strike-specific volume, OI, and the ratio, traders can make informed decisions about:
- Which strikes are actively traded (good for liquidity and tighter spreads)
- Where the market’s bets are concentrated (helping gauge sentiment)
- Potential price magnets near expiration (due to high OI)
This approach allows traders to time entries and exits, choose liquid strikes for spreads, and even anticipate short-term market behavior around key levels.
Final Thoughts
Volume and open interest are the liquidity fingerprints of the options market. Volume measures today’s flow, and open interest measures accumulated state. Together, they tell you whether an option is actively traded, whether positions are being built or closed, and whether the prices you see are reliable.
For systematic traders, ignoring liquidity is like running a backtest with perfect fills at mid-market prices — it looks great until you try to trade it. Real edge comes from understanding not just what to trade, but whether you can actually execute it profitably.
Before calculating expected move, before structuring spreads, before entering any options trade, verify the underlying contracts have sufficient volume and open interest. If they don’t, your theoretical edge evaporates into transaction costs and slippage.
This is the mindset behind The Quantitative Edge — simple ideas, implemented cleanly, that scale into powerful tools for data-driven trading.
Statemi bene!