Description
Before earnings, product launches, or Fed announcements, traders face a critical question: How much will this stock actually move?
The expected move answers this by quantifying the price range a stock is likely to stay within over a given time period — typically until options expiration. Unlike historical volatility, which looks backward, the expected move is forward-looking and derived from implied volatility priced into the options market.
In this post, we’ll explore what the expected move represents, why it matters for both stock and options traders, and how to calculate it using Python and real market data. We’ll use AAPL as our example, walking through the entire calculation step-by-step, providing a complete code using yfinance data, and then discuss how professional traders use this metric to structure trades, set profit targets, and manage risk.
This is a foundational concept for anyone serious about options trading — because the market’s expectation of movement is the trade.
What Is the Expected Move?
The expected move is the one standard deviation price range the market expects a stock to trade within by a specific date, based on current option prices. It’s calculated from implied volatility (IV), which reflects the collective opinion of all options traders about future volatility.
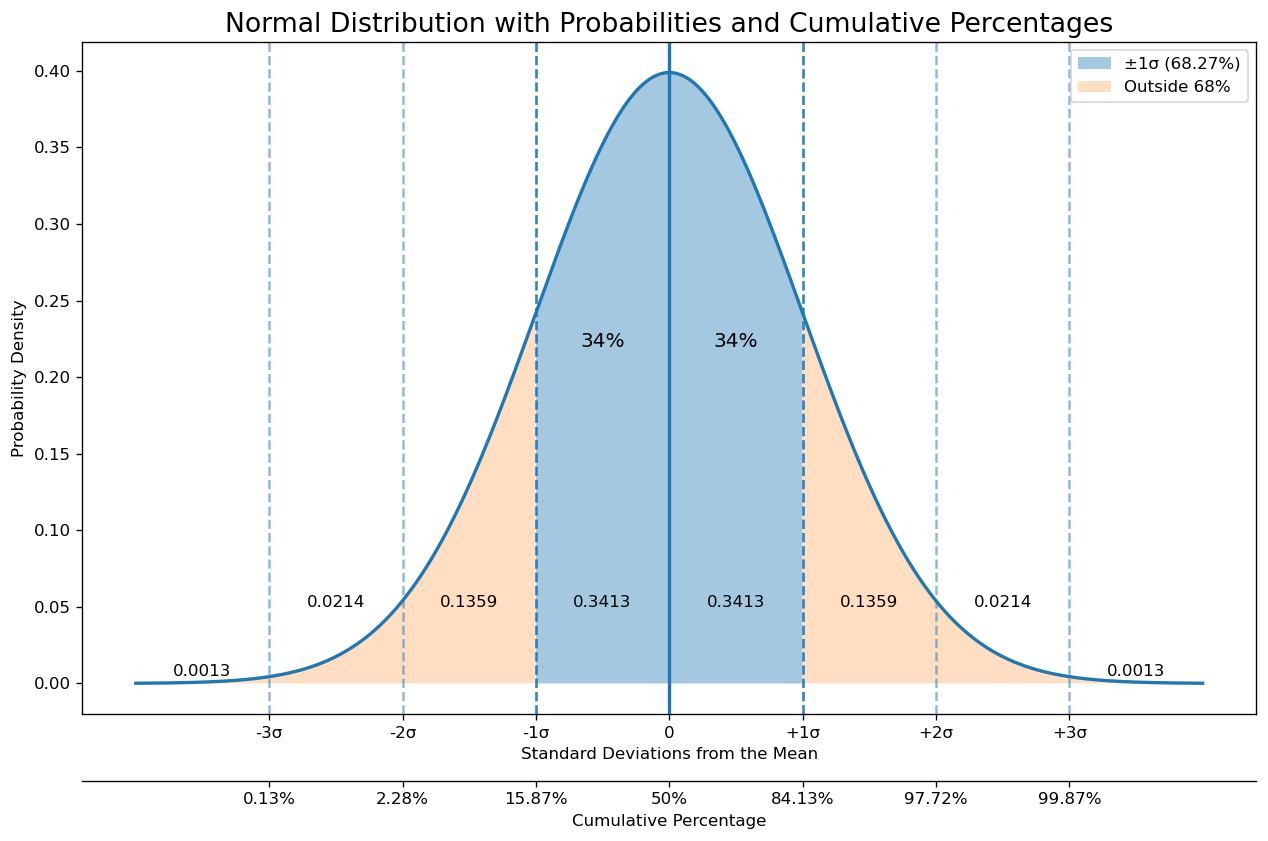
The options pricing model, such as the Black-Scholes, assumes that returns are approximately log-normally distributed, which implies that the price changes behave like a normal distribution when expressed in returns, and the implied volatility is the standard deviation of those returns (annualized). Then the expected move is essentially “one standard deviation” (≈68%) of price movement for a given time period.
In short, the key points are:
- The expected move is a probabilistic measure, not a deterministic valuation.
- It represents roughly a 68% confidence interval (one standard deviation from the Bell curve).
- It’s symmetric around the current price, which means the same $ amount on both sides.
- It adjusts dynamically as IV changes.

For example, if AAPL trades at $180 with a weekly expected move of $5, the market expects AAPL to stay between $175–$185 about 68% of the time. This doesn’t mean it will stay in that range — it means the market has priced options according to this price movement.
Why the Expected Move Matters
The expected move is a critical measure for both stock and options traders because it quantifies the market’s forward-looking volatility expectation in concrete price terms.
For stock traders, the expected move provides a statistical foundation for position management. Instead of arbitrarily placing a stop-loss $10 below your entry, you can set it just outside the expected move to avoid getting stopped out by normal volatility. If AAPL has an expected weekly move of $5 and you’re long at $180, placing your stop at $174 gives you breathing room while still protecting against abnormal weakness. Similarly, the expected move helps size positions appropriately — a stock with a $20 expected move demands smaller position sizing than one with a $5 expected move. It also identifies statistical anomalies: when a stock moves beyond its expected range without obvious news, it often signals the start of a larger trend or breakout.
For options traders, the expected move is even more fundamental. It defines the boundary for selling premium strategies like iron condors and credit spreads. If the expected move is $8, selling an iron condor with short strikes at ±$10 gives you a statistical edge — you’re outside the one standard deviation range. The expected move also helps evaluate option prices: if implied volatility suggests a $6 move but the stock historically moves $10, options are underpriced and favor buyers. It guides strike selection across strategies — buying a call with a breakeven inside the expected move gives you a higher probability than one far outside it. Finally, it determines whether your directional trade has favorable risk-reward: paying $2 for a call spread that profits if the stock moves $5, when the expected move is $8, is statistically sound.
In essence, the expected move tells you what the market thinks will happen. Trading against it doesn’t make you wrong, but it does require a strong thesis backed by evidence or an edge that the market hasn’t priced in.
Calculate the Expected Move
The expected move can be calculated from the option chain’s data by examining the ATM implied volatility (IV), as it best represents the market’s consensus view. Higher IV means a wider distribution and a larger expected move. A lower IV means a tighter distribution and smaller expected move. The expected move (EM) is just the IV scaled to time:
where S is the stock price, and DTE is the number of days until the expiration of the option chosen for evaluation. In this way, the probability is baked into EM by construction.
A more practical and trader-friendly way is to calculate the EM directly from option prices. The market-based formula is:
Why the straddle? A straddle strategy profits only if the stock moves, and loses if the stock does not move. Therefore, the total premium represents the extrinsic value of the option, which includes the time decay, the implied volatility, and the probability of the momevent.
In equilibrium:
The market prices the straddle so that the move required to break even equals the expected move.
That breakeven distance is exactly:
The ATM straddle corresponds to the 1 standard deviation move, which contains ~68% of probability.
The calculation can also be done more accurately by averaging the straddle price with the first ITM strangle, like:
This reflects the real market prices and liquidity of the option chain and what traders are actually paying, rather than theoretical calculations.
How Is It Used in Reality?
Professional options traders use the expected move in multiple ways:
1. Iron Condor Positioning
Selling an iron condor means you profit if the stock stays within a range. Traders often place short strikes outside the expected move to increase win probability.
2. Earnings Plays
Before earnings, IV spikes, inflating the expected move. Traders compare the expected move to historical earnings reactions to find value. If the expected move is $10 but the stock typically moves $6, selling premium might be attractive.
3. Directional Trades
If you’re bullish and the expected move is $8, buying a call with a breakeven $5 above the current price gives you a statistical edge — the market expects the stock to reach that level.
4. Volatility Arbitrage
Comparing expected moves across different expirations reveals term structure inefficiencies. Skewed expectations can signal mispricing.
Python Code
import yfinance as yf
import numpy as np
import matplotlib.pyplot as plt
from datetime import datetime, date

aapl = yf.Ticker("AAPL")

current_price = aapl.history(period='1d')['Close'].iloc[-1]
expirations = aapl.options

# Select the first available expiration (typically nearest)
expiration_date = expirations[0]
print(f"\nUsing Expiration: {expiration_date}")

opt_chain = aapl.option_chain(expiration_date)

calls = opt_chain.calls
puts = opt_chain.puts

# Find ATM call and put
calls['strike_diff'] = abs(calls['strike'] - current_price)
puts['strike_diff'] = abs(puts['strike'] - current_price)

atm_call = calls.loc[calls['strike_diff'].idxmin()]
atm_put = puts.loc[puts['strike_diff'].idxmin()]

# Extract implied volatilities
iv_call = atm_call['impliedVolatility']
iv_put = atm_put['impliedVolatility']

# Average the two for a balanced estimate
atm_iv = (iv_call + iv_put) / 2

print(f"\nATM Call IV: {iv_call:.4f} ({iv_call*100:.2f}%)")
print(f"ATM Put IV: {iv_put:.4f} ({iv_put*100:.2f}%)")
print(f"Average ATM IV: {atm_iv:.4f} ({atm_iv*100:.2f}%)")

# Parse expiration date
exp_datetime = datetime.strptime(expiration_date, '%Y-%m-%d').date()
today = date.today()

dte = (exp_datetime - today).days

# Calculate expected move using IV
expected_move_iv = current_price * atm_iv * np.sqrt(dte / 365)

# Calculate upper and lower bounds
upper_bound_iv = current_price + expected_move_iv
lower_bound_iv = current_price - expected_move_iv

print(f"\n{'='*50}")
print(f"EXPECTED MOVE - METHOD 1 (IV-Based)")
print(f"{'='*50}")
print(f"Stock Price: ${current_price:.2f}")
print(f"ATM IV: {atm_iv*100:.2f}%")
print(f"Days to Expiration: {dte}")
print(f"\nExpected Move: ${expected_move_iv:.2f}")
print(f"Upper Bound (1 SD): ${upper_bound_iv:.2f}")
print(f"Lower Bound (1 SD): ${lower_bound_iv:.2f}")
print(f"\nExpected Range: ${lower_bound_iv:.2f} - ${upper_bound_iv:.2f}")
print(f"{'='*50}")

# ATM Straddle
atm_call_price = atm_call['lastPrice']
atm_put_price = atm_put['lastPrice']
atm_straddle = atm_call_price + atm_put_price

print(f"\n{'='*50}")
print(f"EXPECTED MOVE - METHOD 2 (Market-Based)")
print(f"{'='*50}")

# Find first ITM call (strike below current price)
itm_calls = calls[calls['strike'] < current_price].sort_values('strike', ascending=False)
if len(itm_calls) > 0:
    first_itm_call = itm_calls.iloc[0]
    first_itm_call_price = first_itm_call['lastPrice']
    first_itm_call_strike = first_itm_call['strike']
else:
    first_itm_call_price = 0
    first_itm_call_strike = 0

# Find first ITM put (strike above current price)
itm_puts = puts[puts['strike'] > current_price].sort_values('strike', ascending=True)
if len(itm_puts) > 0:
    first_itm_put = itm_puts.iloc[0]
    first_itm_put_price = first_itm_put['lastPrice']
    first_itm_put_strike = first_itm_put['strike']
else:
    first_itm_put_price = 0
    first_itm_put_strike = 0

# First ITM Strangle
first_itm_strangle = first_itm_call_price + first_itm_put_price

# Calculate market-based expected move
expected_move_market = (atm_straddle + first_itm_strangle) / 2

# Calculate bounds
upper_bound_market = current_price + expected_move_market
lower_bound_market = current_price - expected_move_market

print(f"\nATM Straddle (Strike ${atm_call['strike']:.2f}):")
print(f"  Call: ${atm_call_price:.2f}")
print(f"  Put: ${atm_put_price:.2f}")
print(f"  Total: ${atm_straddle:.2f}")

print(f"\nFirst ITM Strangle:")
print(f"  Call (Strike ${first_itm_call_strike:.2f}): ${first_itm_call_price:.2f}")
print(f"  Put (Strike ${first_itm_put_strike:.2f}): ${first_itm_put_price:.2f}")
print(f"  Total: ${first_itm_strangle:.2f}")

print(f"\nExpected Move (Market-Based): ${expected_move_market:.2f}")
print(f"Upper Bound: ${upper_bound_market:.2f}")
print(f"Lower Bound: ${lower_bound_market:.2f}")
print(f"\nExpected Range: ${lower_bound_market:.2f} - ${upper_bound_market:.2f}")
print(f"{'='*50}")

# Compare both methods
print(f"\n{'='*50}")
print(f"METHOD COMPARISON")
print(f"{'='*50}")
print(f"IV-Based Expected Move: ${expected_move_iv:.2f}")
print(f"Market-Based Expected Move: ${expected_move_market:.2f}")
print(f"Difference: ${abs(expected_move_iv - expected_move_market):.2f}")
print(f"{'='*50}")You can run this code to calculate the expected move using the two different methods described earlier. I ran this code on 2025-12-29 with the closest expiration date on 2026-01-02, getting the following result:
Using Expiration: 2026-01-02

ATM Call IV: 0.1703 (17.03%)
ATM Put IV: 0.1703 (17.03%)
Average ATM IV: 0.1703 (17.03%)
==================================================
EXPECTED MOVE - METHOD 1 (IV-Based)
==================================================
Stock Price: $273.40
ATM IV: 17.03%
Days to Expiration: 3

Expected Move: $4.22
Upper Bound (1 SD): $277.62
Lower Bound (1 SD): $269.18

Expected Range: $269.18 - $277.62
==================================================
EXPECTED MOVE - METHOD 2 (Market-Based)
==================================================
ATM Straddle (Strike $272.50):
  Call: $2.69
  Put: $1.63
  Total: $4.32

First ITM Strangle:
  Call (Strike $272.50): $2.69
  Put (Strike $275.00): $2.95
  Total: $5.64

Expected Move (Market-Based): $4.98
Upper Bound: $278.38
Lower Bound: $268.42

Expected Range: $268.42 - $278.38
==================================================
METHOD COMPARISON
==================================================
IV-Based Expected Move: $4.22
Market-Based Expected Move: $4.98
Difference: $0.76
==================================================
Notice how both methods agree directionally but diverge by $0.76 — the market-based calculation reflects real option prices including skew, liquidity, and trader sentiment that IV alone can’t capture. This 18% difference matters: it’s the gap between theoretical models and actual trading reality. When structuring trades, use the market-based number for strike selection but compare it to the IV-based estimate to gauge whether options are rich or cheap relative to their volatility.
Limitations Traders Should Know
The expected move is a powerful tool, but it’s built on assumptions that don’t always hold in real markets. The calculation assumes stock returns follow a log-normal distribution — meaning price movements are symmetric and predictable. Reality is messier. Markets exhibit fat tails, where extreme moves happen far more often than the model predicts. Black Monday in 1987, the COVID crash, and flash crashes — these events fall entirely outside the statistical framework of expected moves. Around earnings or binary events like FDA approvals, the expected move can be completely unreliable because the distribution becomes bimodal (big move up or big move down), not normally distributed. For equity options, early exercise risk and dividend payments can distort option prices, especially for ITM options, making the straddle/strangle calculation less clean. Despite these limitations, the expected move remains one of the most practical tools in options trading — just remember it’s a statistical guideline, not a guarantee. Use it to inform your decisions, not dictate them.
Final Thoughts
The expected move is one of the most practical tools in an options trader’s arsenal. It transforms abstract implied volatility into a concrete price range, making it easier to structure trades, set realistic expectations, and identify mispricing.
However, remember these caveats:
- 68% probability means the stock breaks out 32% of the time
- Black swan events render historical data and IV meaningless
- Term structure matters — different expirations have different IVs
- Skew effects — calls and puts can price different move probabilities
Before trading, always verify that your calculation matches professional tools like ThinkorSwim or Tastyworks. Slight differences in IV calculation methods can shift the numbers.
This is the mindset behind The Quantitative Edge — simple ideas, implemented cleanly, that scale into powerful tools for data-driven trading.
Statemi bene!