Description
In my previous post on Max Pain, we watched SPY drift from $601.50 to close at $600.08 on expiration Friday — right at the strike with massive open interest. We calculated that $600 was the Max Pain point, where option holders would lose the most money.
But we left one question unanswered: How does this actually happen?
Max Pain tells us where the equilibrium point sits. But what’s the actual mechanism that pulls the price toward it? Why do stocks repeatedly close within pennies of high open interest strikes, especially near expiration?
The answer is pin risk — the gravitational force created by dealer gamma hedging.
When tens of thousands of contracts concentrate at a specific strike, market makers managing that exposure must continuously rebalance their stock hedges. As expiration approaches and gamma explodes, these hedging flows become massive — large enough to literally pull stock prices toward the high-OI strike.
This isn’t a theory or a coincidence. It’s observable market mechanics driven by the mathematical necessity of risk management at scale. Understanding pin risk transforms how you select strikes, time entries, and manage positions near expiration. Let’s explore the machinery beneath the drift.
Pin Risk: When High Open Interest Creates Price Gravity
If max pain is the equilibrium point, pin risk is the mechanism that pulls the price toward it. This can be described, as usual, with a physics analogy.
Imagine a ball on a curved surface. The ball naturally rolls toward the lowest point (potential minimum). Near the minimum, any small push gets dampened — the system returns to equilibrium.
Options markets work similarly:
- High open interest at a strike = deep potential well
- Market maker hedging = restoring force
- Near expiration = steeper well (stronger force)
The closer you get to expiration, the stronger the gravitational pull toward high-OI strikes.
Why Pinning Happens
To understand pinning, we need to first understand how market makers manage risk.
Market makers are typically net short options — when you buy a call or put, they sell it to you. Their business model is to collect the bid-ask spread and option premium, not to speculate on direction. To achieve this, they must remain directionally neutral regardless of how the stock moves, and they use Delta hedging to achieve this. But, What is Delta?
Delta measures how much an option’s price changes for a $1 move in the stock. For example:
- A call with delta = 0.50 gains $0.50 when the stock rises $1
- If a market maker is short that call, they lose $0.50 when the stock rises $1
To offset this directional risk, the market maker buys stock. Specifically:
- Short 1,000 call contracts (delta = 0.50) → exposure = -50,000 deltas
- Buy 50,000 shares of stock → exposure = +50,000 deltas
- Net exposure = 0 (delta neutral)
In theory eveything seems to be working, but here’s the problem: Delta changes as the stock moves, and the value at the beginning of the adjustment is not the same as you planned. This change also has a name,e and it is called Gamma.
Gamma is the rate of change of delta. In physics terms, if delta is velocity, gamma is acceleration. Gamma tells you how much delta will increase or decrease for a $1 move in the stock:
- High gamma → delta changes rapidly (explosive)
- Low gamma → delta changes slowly (stable)
- ATM options have the highest gamma
- Gamma explodes as expiration approaches
How are all those measures used together in the position adjustment? Let me give us a concrete example of a continuous rebalancing.
Imagine that the market maker is short 10,000 ATM calls at $600 strike with a delta of 0.50. To build a market-neutral position, they have to hedge delta by buying 500,000 shares (50,000 deltas × 100 shares per contract). After a certain time, the stock is now at $601. The call position has a delta increase to 0.55 due to gamma, and the new exposure is -55,000 deltas. They must buy another 50,000 shares to re-hedge. If the stock keeps rising, and now it is $602 a share, the call delta is 0.6 (gamma continues pushing delta higher). The new exposure is -60,000 deltas, and they need to buy another 50,000 shares to remain neutral.
Notice the pattern: As the price rises, they must keep buying. This buying pressure acts as an accelerant, pushing prices higher. Conversely, as price falls, they must sell, accelerating the decline.
Now here’s where pinning happens: Near expiration with massive OI at a specific strike, the forces reverse depending on which side of the strike you’re on:
- Above the high-OI strike: All those calls go ITM, dealers must buy massive amounts to hedge → but this buying exhausts itself and creates resistance
- Below the high-OI strike: All those puts go ITM, dealers must sell massive amounts to hedge → but this selling exhausts itself and creates support
The result: opposing forces balance at the high-OI strike, creating an equilibrium where the stock gets “pinned.”
Concrete Example
I understand that all these dynamics can be confusing, and it might make no sense for a retail trader. However, the only thing I recommend is to learn what moves the market and how, in order to look for a reasonable edge that can have a causal sense and can sustain your trading decisions. Be with me, where I give you another concrete example of this dynamic.
Let’s take SPY, and now the market maker has 75,000 contracts at $600.
If SPY rises from $600 to $601, the 75,000 calls go deeper ITM (delta increases from 0.50 toward 1.00). The dealers who are short these calls now have larger negative delta exposure. To re-hedge, they must buy more stock, but this buying happens as the price rises, so they’re buying at higher prices. As they buy, they push the price higher, which triggers more buying (positive feedback). Eventually, this buying demand gets exhausted, and future upward moves face resistance. Why resistance? Because continued upward moves require even more buying to hedge, and at some point, the capital required becomes prohibitive.
If SPY falls from $600 to $599, the 75,000 puts go deeper ITM (delta increases from 0.50 toward 1.00). The Dealers who are short these puts now have larger positive delta exposure. To re-hedge, they must sell stock, but this selling happens as the price falls, so they’re selling at lower prices. As they sell, they push the price lower, which triggers more selling (positive feedback). Eventually, this selling pressure gets exhausted, and future downward moves face support. Why support? Because continued downward moves require even more selling to hedge, and at some point, they run out of stock to sell, or the capital requirements become too large.
The key insight: when the dealers are short gamma (which they typically are), their hedging amplifies the current move but eventually creates exhaustion that reverses into resistance/support.
At exactly a $600 price, the maximum uncertainty occurs (ATM = 0.50 delta for both calls and puts), and maximum gamma exists (delta changes fastest here). Any small move requires massive rehedging, and this is where the price stabilizers and the pinning occur. On expiration day (0 DTE), this effect becomes extreme. With hours remaining, gamma approaches infinity at ATM. Even a $0.10 move can require millions in hedging. This is why stocks so often close within pennies of strikes with enormous open interest — the hedging forces are simply too large to fight.
Consider now the scenario where SPY is trading at $602, the $600 strike has 75,000 contracts open interest, the $605 strike has 35,000 contracts, and we have 3 days to expiration. As expiration approaches, the dealers are short massive gamma at $600. As SPY drops from $602 toward $600, dealers must sell stock to hedge and this selling pressure accelerates the move toward $600. Once at $600, forces balance — further moves require fighting dealer hedging. The result: price “pins” near $600.
Identifying Pin Risk
Pin risk is highest when open interest is highly concentrated at one or two strikes and time to expiration is < 3 days. The strike is near the current price (within 1-2%).
Let’s build Python code to systematically identify pin candidates.
import yfinance as yf
import pandas as pd
import numpy as np
import matplotlib.pyplot as plt
from datetime import datetime

# Download SPY data (same as max pain post)
spy = yf.Ticker("SPY")
spy_price = spy.history(period='1d')['Close'].iloc[-1]

print(f"SPY Current Price: ${spy_price:.2f}")

# Get nearest expiration
expirations = spy.options
expiration = expirations[0]
print(f"Analyzing Expiration: {expiration}")

# Calculate DTE
exp_datetime = datetime.strptime(expiration, '%Y-%m-%d')
dte = (exp_datetime - datetime.now()).days
print(f"Days to Expiration: {dte}")

# Download option chain
chain = spy.option_chain(expiration)
calls = chain.calls
puts = chain.puts

# Filter for relevant strikes (±15%)
strike_range = 0.15
lower_bound = spy_price * (1 - strike_range)
upper_bound = spy_price * (1 + strike_range)

calls_filtered = calls[
    (calls['strike'] >= lower_bound) &
    (calls['strike'] <= upper_bound)
].copy()

puts_filtered = puts[
    (puts['strike'] >= lower_bound) &
    (puts['strike'] <= upper_bound)
].copy()

print(f"\nAnalyzing {len(calls_filtered)} strikes within ±15%")Combine Call and Put Open Interest
# Combine call and put open interest by strike
total_oi_by_strike = pd.DataFrame({
    'strike': calls_filtered['strike'],
    'call_oi': calls_filtered['openInterest'],
})

# Merge with puts
puts_oi = puts_filtered[['strike', 'openInterest']].rename(columns={'openInterest': 'put_oi'})
total_oi_by_strike = total_oi_by_strike.merge(puts_oi, on='strike', how='outer').fillna(0)

total_oi_by_strike['total_oi'] = total_oi_by_strike['call_oi'] + total_oi_by_strike['put_oi']
total_oi_by_strike = total_oi_by_strike.sort_values('total_oi', ascending=False)

print(f"\n{'='*60}")
print(f"PIN RISK ANALYSIS - Highest OI Strikes")
print(f"{'='*60}")

print(f"\nTop 5 Strikes by Total Open Interest:")
pin_risk_strikes = []

for i, (idx, row) in enumerate(total_oi_by_strike.head(5).iterrows()):
    distance = row['strike'] - spy_price
    distance_pct = (distance / spy_price) * 100

    print(f"\n  #{i+1}: ${row['strike']:.2f}")
    print(f"      Total OI: {row['total_oi']:,.0f} contracts")
    print(f"      Calls: {row['call_oi']:,.0f} | Puts: {row['put_oi']:,.0f}")
    print(f"      Distance: ${distance:+.2f} ({distance_pct:+.2f}%)")

    # Assess pin risk based on distance and DTE
    if abs(distance_pct) < 0.5 and dte <= 3:
        risk_level = "EXTREME"
        print(f"      ⚠️  EXTREME pin risk - Very close with expiration imminent")
    elif abs(distance_pct) < 1.0 and dte <= 5:
        risk_level = "HIGH"
        print(f"      ⚠️  HIGH pin risk - Close proximity and near expiration")
    elif abs(distance_pct) < 2.0:
        risk_level = "MODERATE"
        print(f"      →  Moderate pin risk - Could drift toward this level")
    else:
        risk_level = "LOW"
        print(f"      →  Low pin risk - Too far from current price")

    pin_risk_strikes.append({
        'strike': row['strike'],
        'total_oi': row['total_oi'],
        'call_oi': row['call_oi'],
        'put_oi': row['put_oi'],
        'distance': distance,
        'distance_pct': distance_pct,
        'risk_level': risk_level
})Calculate Open Interest concentation
# Calculate OI concentration metrics
top_strike_oi = total_oi_by_strike.iloc[0]['total_oi']
total_oi = total_oi_by_strike['total_oi'].sum()
concentration = (top_strike_oi / total_oi) * 100
print(f"\n{'='*60}")
print(f"OI CONCENTRATION METRICS")
print(f"{'='*60}")
print(f"Largest strike: ${total_oi_by_strike.iloc[0]['strike']:.2f}")
print(f"OI at largest strike: {top_strike_oi:,.0f} ({concentration:.1f}% of total)")
if concentration > 20:
print(f"\n→ VERY HIGH concentration - Strong pinning likely")
print(f"→ Price has high probability of closing near ${total_oi_by_strike.iloc[0]['strike']:.2f}")
elif concentration > 15:
print(f"\n→ HIGH concentration - Pinning risk significant")
print(f"→ Monitor price action near ${total_oi_by_strike.iloc[0]['strike']:.2f}")
elif concentration > 10:
print(f"\n→ MODERATE concentration - Some pinning possible")
print(f"→ Be aware of potential drift toward major strikes")
else:
print(f"\n→ LOW concentration - OI is distributed, pinning unlikely")
print(f"→ Normal price action expected")
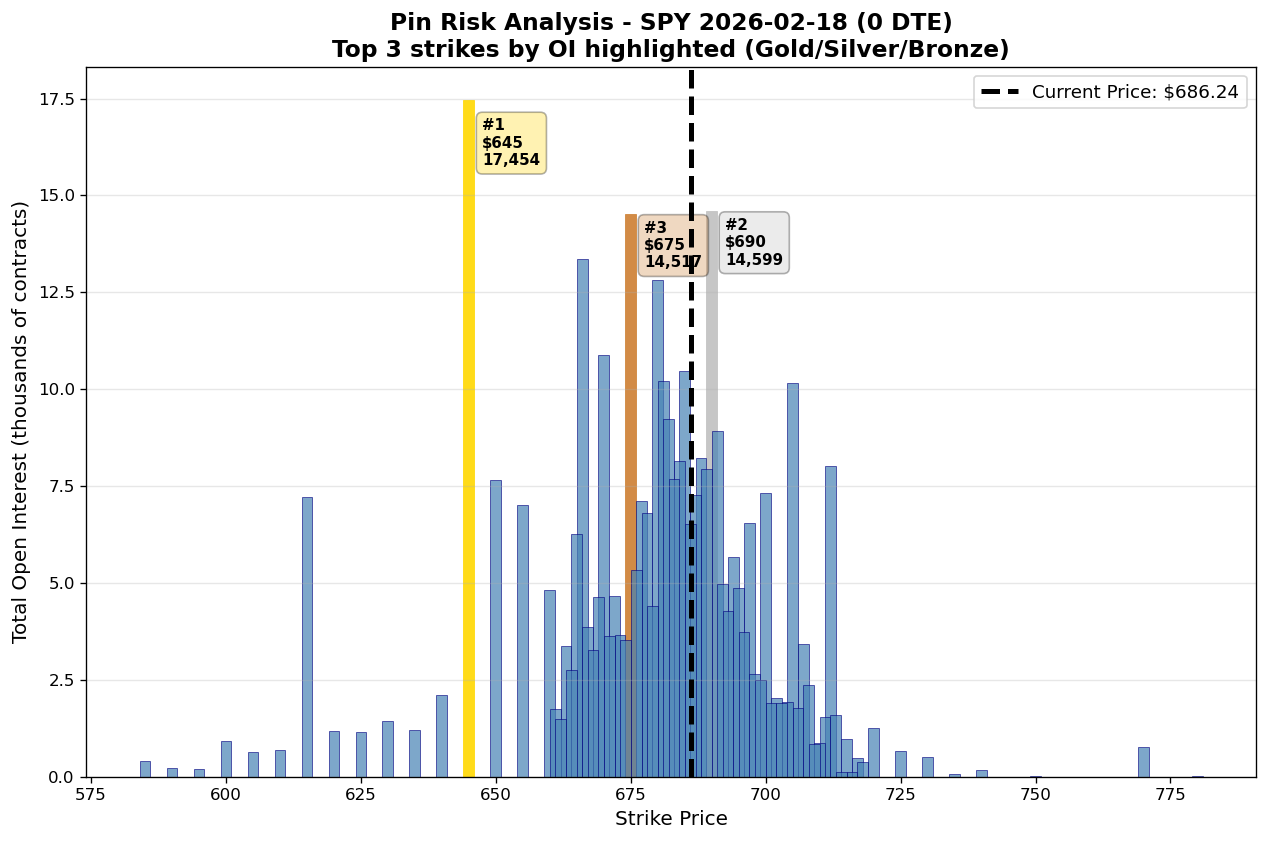
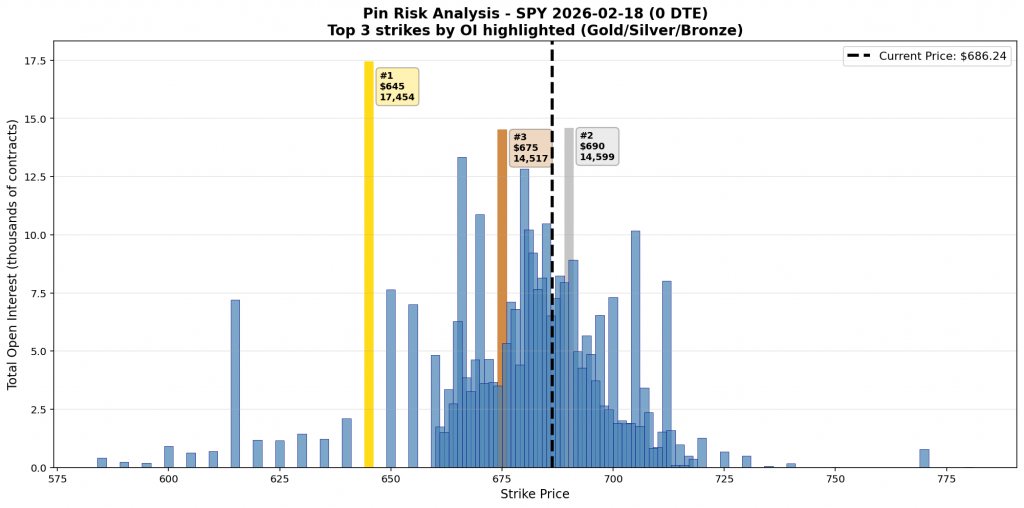
print(f"{'='*60}")Key observation from the analysis of the SPY on 0DTE 2026-02-18:
SPY Current Price: $686.24
Analyzing Expiration: 2026-02-18
Days to Expiration: 0

Analyzing 78 strikes within ±15%

============================================================
PIN RISK ANALYSIS - Highest OI Strikes
============================================================

Top 5 Strikes by Total Open Interest:

  #1: $645.00
      Total OI: 17,454 contracts
      Calls: 2 | Puts: 17,452
      Distance: $-41.24 (-6.01%)
      →  Low pin risk - Too far from current price

  #2: $690.00
      Total OI: 14,599 contracts
      Calls: 11,323 | Puts: 3,276
      Distance: $+3.76 (+0.55%)
      ⚠️  HIGH pin risk - Close proximity and near expiration

  #3: $675.00
      Total OI: 14,517 contracts
      Calls: 1,242 | Puts: 13,275
      Distance: $-11.24 (-1.64%)
      →  Moderate pin risk - Could drift toward this level

  #4: $666.00
      Total OI: 13,350 contracts
      Calls: 334 | Puts: 13,016
      Distance: $-20.24 (-2.95%)
      →  Low pin risk - Too far from current price

  #5: $680.00
      Total OI: 12,829 contracts
      Calls: 4,862 | Puts: 7,967
      Distance: $-6.24 (-0.91%)
      ⚠️  HIGH pin risk - Close proximity and near expiration

============================================================
OI CONCENTRATION METRICS
============================================================
Largest strike: $645.00
OI at largest strike: 17,454 (4.9% of total)

→ LOW concentration - OI is distributed, pinning unlikely
→ Normal price action expected
============================================================
A clear visualization makes pin risk immediately obvious.
Trading Implications
Understanding pin risk fundamentally changes how you approach strike selection and position management.
For example, you can use it for strike selection in case you want to sell premiums. When selling premium (iron condors, credit spreads, naked puts/calls):
DO:
- Check the top 3 OI strikes before selecting your shorts
- Sell strikes away from high-OI concentration zones
- Use pin risk as a filter, not your primary selection criteria
DON’T:
- Sell premium AT the highest OI strike within 3 DTE
- Ignore concentration metrics when close to expiration
- Assume high OI always means pinning (need proximity + low DTE)
Example:
- SPY at $600, $600 strike has 75k OI, 3 DTE
- Bad: Sell $600 puts or calls (you’re at max pin risk)
- Good: Sell $595 puts or $605 calls (outside pin zone)
Pin risk reflects a tendency, not a guarantee. Pinning can break down when a strong directional catalyst overwhelms dealer hedging flows, when volume is too thin for hedging activity to matter, when open interest is widely distributed rather than concentrated at a strike, or when the underlying is experiencing extreme volatility.
Traders should not trade purely based on pin risk and assume pinning will always occur. Do not ignore fundamentals or broader market context, or fight strong trends while expecting the price to snap back to a strike.
Instead, pin risk should be used as one input among many, with awareness increasing as DTE decreases. It’s generally wise to avoid selling premium at extreme pin zones and to exploit pinning behavior only with clear risk management in place.
Final Thoughts
Pin risk explains the “how” behind max pain’s “where.” When you see a stock close exactly at $600.00 on expiration Friday with 75,000 contracts at that strike, you’re witnessing the mechanical consequence of dealer gamma hedging at scale.
This isn’t speculation or market manipulation — it’s observable physics. Dealers managing billions in option exposure must continuously rebalance their stock hedges. With massive OI at a specific strike and expiration approaching, these hedging flows become large enough to influence price directly.
This is the mindset behind The Quantitative Edge — simple ideas, implemented cleanly, that scale into powerful tools for data-driven trading.
Statemi bene!