Description
It’s Friday late evening, and I am trading options. The market closes in a few hours, and I am monitoring my positions before the options expiration. I am watching SPY trade at $601.50, and I notice something strange: massive open interest sits at the $600 strike. Over the next hour, despite no obvious news, SPY drifts down to close at $600.08. On Monday, I see the same pattern repeat — the stock closed within pennies of a high open interest strike.
Is this a coincidence or is there an explaination about this behaviour? And, as usual, I think about Physics. Just like a ball rolling toward the lowest point in a gravitational field, stock prices near expiration experience forces that pull them toward strikes with concentrated open interest. This isn’t market manipulation or conspiracy — it’s the mechanical consequence of market maker hedging.
In the previous blog (Liquidity), I showed you how to screen for liquid options. Now we explore what happens when those liquid options accumulate enormous open interest at specific strikes — creating max pain levels that literally influence price behavior.
This is where market microstructure meets observable price dynamics. Understanding these forces gives you an edge in strike selection, timing, and position management.
Max Pain: The Strike Where Option Sellers Win
Max Pain theory suggests that, as expiration approaches, the stock prices tend to gravitate towards the strike where the largest number of options expire worthless, causing the option holders the maximum loss at expiration. This is happening at the strike price with the highest total open interest (calls + puts) — equivalently, where option sellers experience maximum profit. (This is another reason why I prefer to be on the sell side, rather than on the buy side).
Think about the options market structure for a moment. The logic is that retail and institutional traders tend to have a net long options position (buy premium), while the market maker has a net short options position (sell premium) to guarantee the options market liquidity and tradability.
Market makers profit when options expire worthless or with minimal intrinsic value. Their hedging activity, which we’ll explore in another article, creates subtle price pressure toward the strike that maximizes their profit.
Market makers profit when options expire worthless or with minimal intrinsic value. Their hedging activity, which we’ll explore in another article, creates subtle price pressure toward the strike that maximizes their profit.
The strike where the Max Pain is, it can be calculated easily with a Python script. Let’s first define it precisely.
For a given expiration date, we consider the strike prices and the open interest. The number of unsettled contracts at a specific strike can give us an understanding of how much money is tied to that level.
Then we calculate the payoff for each strike for all the calls and the puts, assuming that the stock price closes at that particular strike.
- For calls: Payoff = Max(0, Stock Price – Strike Price) × Open Interest.
- For puts: Payoff = Max(0, Strike Price – Stock Price) × Open Interest.
Adding together the call and put payoffs at that particular strike gives the amount of loss the option sellers face if the stock price closes at that price level. The strike price at which the option sellers have the minimum total loss or maximize the profit defines the Max Pain price. At Max Pain, the maximum number of options expire worthless, and option buyers lose the most premium.
Does it really matter?
Compared to volume or open interest, the Max Pain price is often less actionable. Many traders consider it controversial because it assumes prices move toward a specific strike, but that movement can be manipulated by the big players or may simply happen by chance. Nevertheless, it can be used to give insights about the price movement near option expiration.
Does it really matter to me as an options trader? I would say that this information can be used as a reference point and not as a trading strategy by itself. For example, if the stock is trading $10 away from max pain with 3 days until expiration, you might expect drift toward that level absent strong directional catalysts.
The maximum pain is not a precise forecasting tool. At best, it offers a rough indication of where the market expects options to lose value at expiration, assuming relatively stable and orderly market conditions. When volatility spikes or strong directional flows appear, its predictive power often weakens.
Remember also where you are playing. When an option expires worthless, the seller retains the entire premium collected upfront. For market makers, consistently capturing these premiums—while managing risk through hedging—is a core component of how profits are generated in options markets.
Contrary to popular belief, the majority of options do not simply expire unused. According to the Chicago Board Options Exchange (CBOE), the latest statistics I found on the web cited:
- 10% of option contracts are exercised early, effectively used for protection and hedging.
- 50–60% of option contracts are closed out before expiration, often as part of active risk management or strategy adjustments.
- 30–40% of option contracts expire worthless, meaning they’re out-of-the-money with no intrinsic value.
These statistics reveal something crucial: the majority of options (60-70%) never reach expiration. Traders actively manage positions, closing winners early and cutting losers before they expire worthless.
Even though most options close early, the open interest that remains near expiration represents the positions that weren’t closed — often large hedges, institutional positions, and underwater retail trades. These are precisely the positions that create dealer hedging pressure. As traders close profitable positions throughout the week, what’s left is increasingly concentrated at strikes where dealers have the most exposure to manage.
For the 30-40% of the options that expire worthless, this is where max pain becomes most relevant. On expiration day, roughly one-third of all open interest will expire with zero value. Max pain predicts where these worthless expirations will cluster. If max pain is at $600 and the stock closes at $600.05, calls above $600 and puts below $600 all expire worthless simultaneously — exactly what the theory predicts.
For options traders, this lifecycle helps in understanding how you should behave. Here are my guiding rules:
- Don’t assume everything expires — most positions close early, so manage yours actively.
- Max pain becomes more relevant as expiration approaches — the positions that remain are the ones dealers must hedge most aggressively.
- The 30-40% worthless statistic supports max pain — it shows that a significant portion of OI does reach expiration, and price gravitates to maximize this.
- Close winners early — if you’re part of the 50-60%, closing early, you’re taking profit before dealer hedging pressure intensifies.
Max pain isn’t about every option expiring worthless — it’s about the equilibrium point where the remaining positions create balanced hedging pressure that stabilizes price.
Python Calculations
Let’s implement the calculation from scratch using AAPL options. The function below can be used to calculate the Max Pain for the option chains given as input. The chain can be retrieved using the code in the previous blog on Volume and Open Interest (Ref: Article).
def calculate_max_pain(calls, puts):
    """
    Calculate max pain - the strike where option holders lose the most

    At each potential expiration price:
    - Calls with strike < price are ITM (have value)
    - Puts with strike > price are ITM (have value)
    - Max pain = price where total ITM value is minimized
    """
    # Get all unique strikes from both calls and puts
    all_strikes = sorted(set(calls['strike'].tolist() + puts['strike'].tolist()))

    max_pain_data = []

    for test_price in all_strikes:
        # Calculate total value of ITM calls at this price
        # Calls are ITM when strike < test_price
        itm_calls = calls[calls['strike'] < test_price].copy()
        itm_calls['value'] = (test_price - itm_calls['strike']) * itm_calls['openInterest'] * 100
        call_value = itm_calls['value'].sum()

        # Calculate total value of ITM puts at this price
        # Puts are ITM when strike > test_price
        itm_puts = puts[puts['strike'] > test_price].copy()
        itm_puts['value'] = (itm_puts['strike'] - test_price) * itm_puts['openInterest'] * 100
        put_value = itm_puts['value'].sum()

        # Total value = loss for option buyers = profit for option sellers
        total_value = call_value + put_value

        max_pain_data.append({
            'strike': test_price,
            'call_value': call_value,
            'put_value': put_value,
            'total_value': total_value
        })

    max_pain_df = pd.DataFrame(max_pain_data)

    # Find the strike with minimum total value
    min_idx = max_pain_df['total_value'].idxmin()
    max_pain_strike = max_pain_df.loc[min_idx, 'strike']
    min_value = max_pain_df.loc[min_idx, 'total_value']

return max_pain_strike, max_pain_dfThe dataframe of the Max Pain computed can be used to make a nice visualization, similar to the one founded in some commercial platform.
# Create max pain visualization
fig, (ax1, ax2) = plt.subplots(2, 1, figsize=(14, 10))

# Top panel: Max pain curve
ax1.plot(max_pain_df['strike'], max_pain_df['total_value'] / 1e6,
         linewidth=3, color='purple', label='Total Option Value at Expiration')

# Mark current price
ax1.axvline(aapl_price, color='black', linestyle='--', linewidth=2.5,
           label=f'Current Price: ${aapl_price:.2f}', alpha=0.7)

# Mark max pain strike
ax1.axvline(max_pain_strike, color='red', linestyle='--', linewidth=2.5,
           label=f'Max Pain: ${max_pain_strike:.2f}', alpha=0.7)

# Highlight the minimum point
min_idx = max_pain_df['total_value'].idxmin()
ax1.scatter(max_pain_df.loc[min_idx, 'strike'],
           max_pain_df.loc[min_idx, 'total_value'] / 1e6,
           color='red', s=300, zorder=5, marker='*',
           edgecolors='darkred', linewidths=2)

# Shade the region between current and max pain
if max_pain_strike > aapl_price:
    ax1.axvspan(aapl_price, max_pain_strike, alpha=0.2, color='green',
               label='Potential Upward Drift')
else:
    ax1.axvspan(max_pain_strike, aapl_price, alpha=0.2, color='red',
               label='Potential Downward Drift')

ax1.set_xlabel('Strike Price at Expiration', fontsize=12)
ax1.set_ylabel('Total Option Value ($M)', fontsize=12)
ax1.set_title(f'Max Pain Analysis - AAPL {expiration}\nOption buyers lose most at the minimum',
             fontsize=14, fontweight='bold')
ax1.legend(fontsize=10)
ax1.grid(True, alpha=0.3)

# Bottom panel: Call vs Put contribution
ax2.plot(max_pain_df['strike'], max_pain_df['call_value'] / 1e6,
        linewidth=2, color='green', label='Call Value', alpha=0.7)
ax2.plot(max_pain_df['strike'], max_pain_df['put_value'] / 1e6,
        linewidth=2, color='red', label='Put Value', alpha=0.7)
ax2.axvline(aapl_price, color='black', linestyle='--', linewidth=2, alpha=0.5)
ax2.axvline(max_pain_strike, color='purple', linestyle=':', linewidth=2, alpha=0.7)

ax2.set_xlabel('Strike Price at Expiration', fontsize=12)
ax2.set_ylabel('ITM Option Value ($M)', fontsize=12)
ax2.set_title('Call vs Put Value by Expiration Price', fontsize=13, fontweight='bold')
ax2.legend(fontsize=10)
ax2.grid(True, alpha=0.3)

plt.tight_layout()
plt.show()I ran this code on 30/01/2026, choosing the next week’s expiration for illustration.
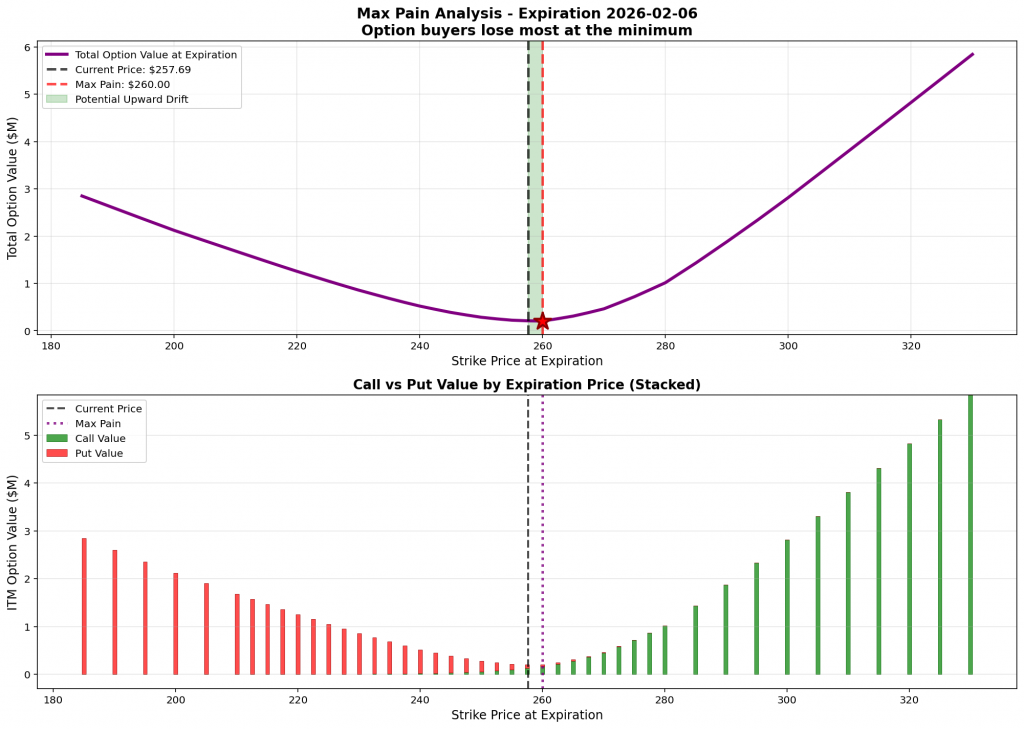
Key observation from the plot is that the option:
- Current AAPL Price: $257.69
- Max Pain Strike: $260.00
- Distance: $2.31 (+0.90%)
- Total Option Value at Max Pain: $204k
- Price is very close to max pain (0.90%)
- Expect potential pinning behavior at $260.00
The red star in the graph corresponds to where option buyers lose the most money; market maker hedging creates a slight bias toward this level. This effect is strongest within 3 days of expiration.
Final Thoughts
Max pain is an observable phenomenon driven by the mechanical necessity of market maker hedging. It is not market manipulation — it is a consequence of dealer risk management at a massive scale.
When you see a stock close at exactly $600.00 on expiration Friday with 100,000 contracts of open interest at that strike, you’re witnessing physics, not magic. Dealers had billions in exposure and adjusted their hedges continuously to stay neutral, creating the equilibrium outcome.
Understanding these forces doesn’t give you a crystal ball, but it does provide context for position sizing, strike selection, and timing. It’s one more piece of market structure knowledge that separates systematic traders from those trading on hope.
In the next article, we’ll dive deeper into the Pining Effect — the mechanism that pulls price into a certain strike.
This is the mindset behind The Quantitative Edge — understanding the machinery beneath price action.
Statemi bene!