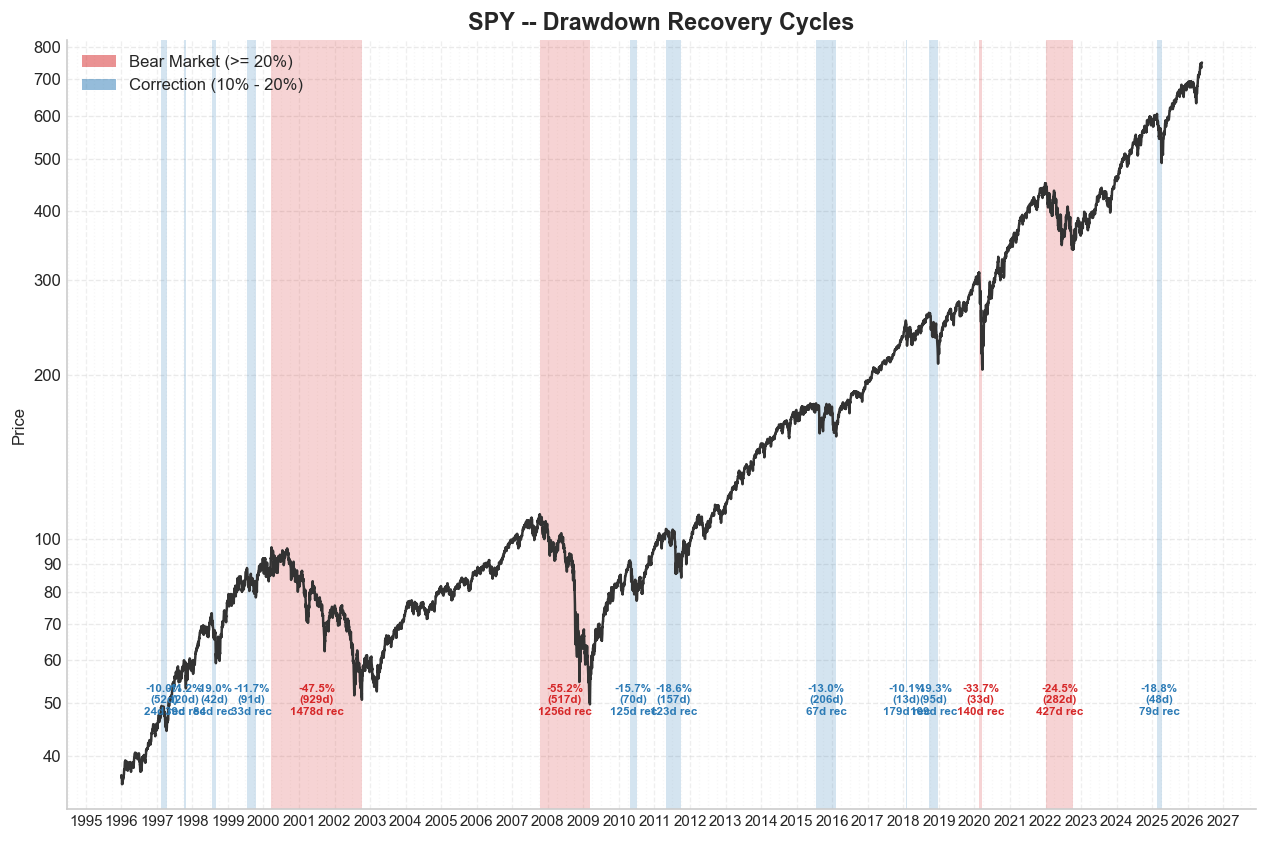
The Anatomy of Bear Markets

Every trader fears the bear market. But how many have actually studied one? I ran a full cycle analysis on SPY, from 1996 to 2026, nearly 30 years and 7,650 trading days. I classified every significant drawdown into bear markets, corrections, and small corrections. Then I measured the duration, the depth, and the recovery time for each one.

0 Comments

The Bull Put Spread Trade on Seasonal Edge

On April 1st, SeasonHunter flagged a seasonal pattern on Hasbro (HAS) with a 77.8% win rate across 45 years of data. I opened a Bull Put Spread with less than $500 of margin. Seventeen days later, I closed it with $162 in profit. That's a 32% return on deployed capital, while the stock itself moved only 5.3%. In this article I walk through the complete trade lifecycle: the SeasonHunter signal, the spread structure, the exit rule I use when premium decays faster than time passes, and why capital efficiency is the real argument for options over equity in seasonal strategies.

0 Comments

Spread Trading with Z-Score

Pairs trading exploits the principle of relative value. Like in physics, we sometimes do not care only about absolute values — we care about deviations from a reference state. In this post, we'll use Python to construct a spread strategy between two stocks.

0 Comments

Analyzing and Detrending Yearly Cumulative Returns

Stock prices — and even their cumulative returns — often show long-term upward or downward trends that can mask underlying behavior. In this post, we’ll use Python to calculate the yearly cumulative returns of a stock, understand what this metric really means, and then detrend the return series to reveal its true fluctuations and relative performance over time.

0 Comments