Reading Options Volume and Open Interest

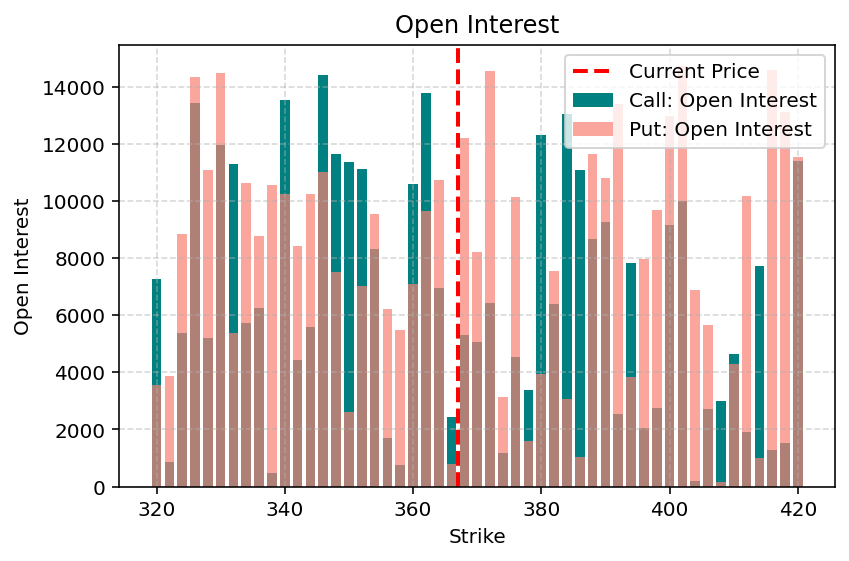
I often find that a simple physics analogy makes trading concepts easier to grasp, particularly when explaining the difference between what’s moving and what’s already there, the flux and the state. The flux measures flow through a surface, like current through a wire. The state describes what exists at a point in time, like charge accumulated in a capacitor. Options markets have a similar duality: volume measures the flow of contracts trading today, while open interest describes the total number of contracts that are still open and exist in the market.

0 Comments

Expected Move: The Options Trader’s Guide

Before earnings, product launches, or Fed announcements, traders face a critical question: How much will this stock actually move? The expected move answers this by quantifying the price range a stock is likely to stay within over a given time period — typically until options expiration. Unlike historical volatility, which looks backward, the expected move is forward-looking and derived from implied volatility priced into the options market.

0 Comments

Spread Trading with Z-Score

Pairs trading exploits the principle of relative value. Like in physics, we sometimes do not care only about absolute values — we care about deviations from a reference state. In this post, we'll use Python to construct a spread strategy between two stocks.

0 Comments

Analyzing and Detrending Yearly Cumulative Returns

Stock prices — and even their cumulative returns — often show long-term upward or downward trends that can mask underlying behavior. In this post, we’ll use Python to calculate the yearly cumulative returns of a stock, understand what this metric really means, and then detrend the return series to reveal its true fluctuations and relative performance over time.

0 Comments

A Practical Guide to Retrieving Options Data

Understanding options data is essential if you want to move from theory to actual, structured trading strategies. Whether you’re tracking implied volatility, evaluating premiums, or building spreads, the first step is always the same: fetching the option chain.

0 Comments

Adjusted vs. Unadjusted Prices: The Hidden Trap

In quantitative trading, like in physics, every model starts with data — and often, that means historical prices. But not all price data is created equal. One of the most overlooked — and misunderstood — aspects of market data is the distinction between adjusted and unadjusted stock prices. It might seem like a small technical detail, but it’s often the difference between a strategy that looks profitable —and one that truly is making money. In this post, I’ll unpack why that distinction matters.

0 Comments

Building Walk-Forward Date Splits for Backtesting

When I first started backtesting strategies, I thought one long backtest was enough. It wasn’t. Markets change, conditions shift, and what worked in one year might fail in the next. That realization led me to walk-forward analysis — a systematic way to simulate how a strategy learns and adapts over time. In this post, I’ll show you how to generate the date sequences that make this method possible using Python.

0 Comments